|
Well, I learned a lot about blogging this year...most importantly that it's really easy for me to quit blogging! My goal for this blog was to have a record of what students are doing in my class in order to inform parents. I did a great job at the beginning of last year keeping up with it, but it didn't take long before I just got too busy.
I'm going to try to remedy this in 2 ways: 1. I'm going to use Twitter to get the day to day activities out there and save the blog for more of a weekly task. 2. I'm going to eventually have students take over the blog and write about their experiences. Hopefully with these changes I'll do a better job at informing parents of all the amazing math we are doing in class. I'm excited to get to know and work with this group of 7th graders!
0 Comments
Today we used Desmos to make Valentines! Here are a few of the amazing creations the students came up with. There was lots of math love (and learning) going on in class today! One valentine needs to be seen live....you can view it here
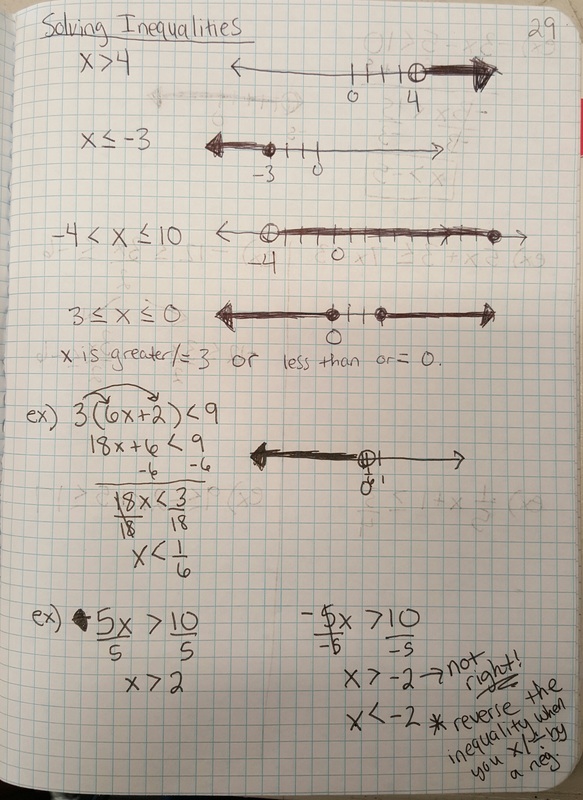
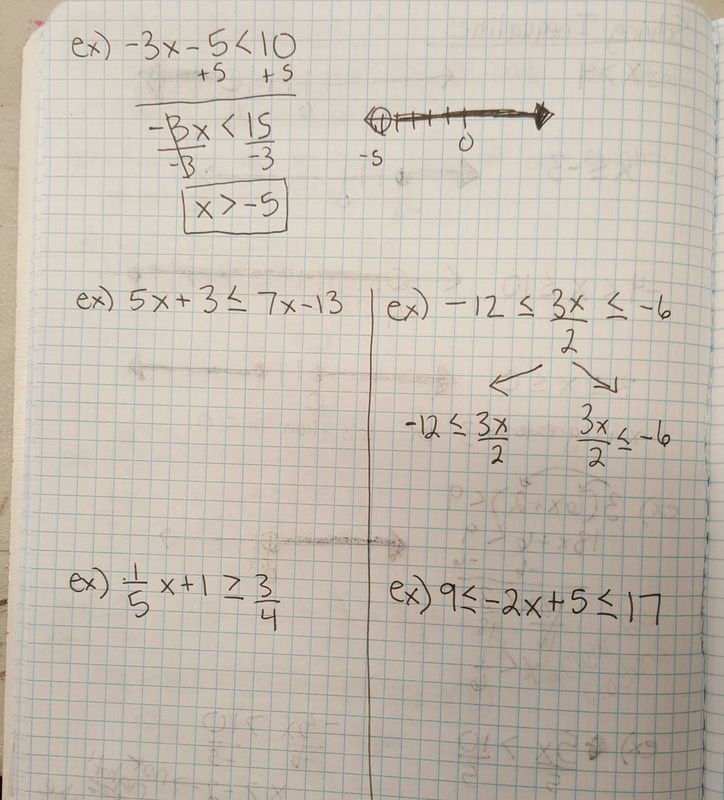
Today we started our first Problem of the Month (POM). A POM is a set of 5 problems that are related and increasing in difficulty. Students work for 15-20 minutes a day on the problems for 5 days. On the last day, we share our thinking on the problems as well as view how other students solved them using Voice Thread. After the POM, we worked more on solving inequalities. I told students to expect a SWYK on Monday.
Today we spent a little time reviewing solving equations and talking about inequalities. We took notes over the topics and practiced some examples. Then, they got to spend the rest of the time on the desmos marble slide activity from yesterday! :) 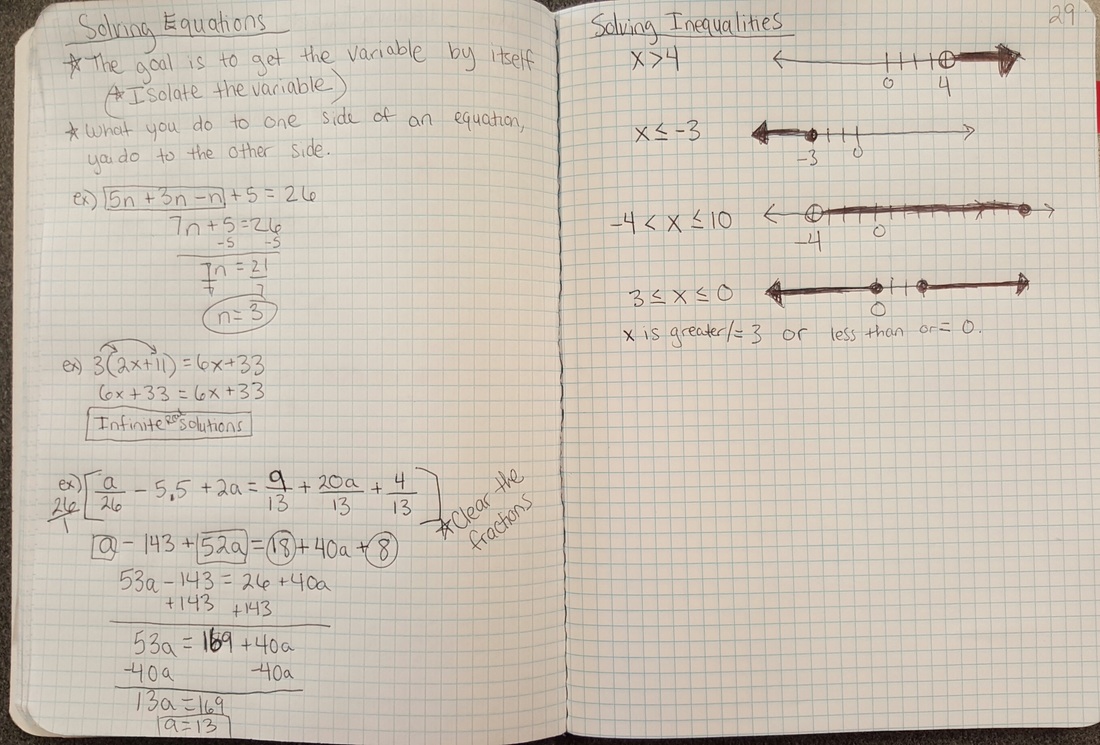 Welcome back! I wanted to start off today with something that would engage students since I'm sure they had as hard of a time getting up this morning as I did. We did an activity on desmos called Marbleslides. The goal was to change equations in the graphing calculator to make a ball pass through given stars. This activity is fun and engaging, plus it allows students to review what we worked on before break with graphs and slope-intercept form.
Today was the big day! Students finished up graphing and analyzing their data and making their bungee strings. Then we went out for our first run. Most groups were able to go and I will say, I was very pleased that we had no Barbie deaths!!! :) You can watch the video of the jumps below. Today, the students were able to finish any trial drops to collect data and then were asked to analyze it. They graphed the data points, drew a line of best fit, write an equation for the line and will then use that to predict how many rubber bands will be needed for their doll to drop from a certain height in a way that it gets as close to the ground as possible. Students were also able to use the online graphing calculator on Desmos.com to make a table of their data and generate the actual line of best fit to see how close their line was that they drew. Desmos is a great free online too for teachers and students (and maybe even parents) to graph functions, plot tables of data, evaluate equations, explore transformations, and much more! This week we're doing our Barbie Bungee project! We started off by looking at a couple videos of the world's tallest bungee jump and talking about what makes a bungee jump the most fun. The students decided that the person should drop as close to the ground as possible without touching it. Then, I gave each group a Barbie and some rubber bands to start collecting data about how far their Barbie drops compared to how many rubber bands were used. Eventually, the students will have to create a full sized Barbie Bungee cord for an undisclosed location. We plan on having the actual jump on Thursday. It'll be exciting to see which group gets their Barbie closest to the ground without hitting it! |
AuthorWrite something about yourself. No need to be fancy, just an overview. Archives
June 2016
Categories |
 RSS Feed
