|
Today, students finished up or made corrections on their credit card projects if needed and we did a quick summary about what they learned. Then, they did some graphical analyzing looking at U.S. consumer spending patterns over the past 10 years, as well as making predictions about the future. Why do you think the graphs look the way they do? 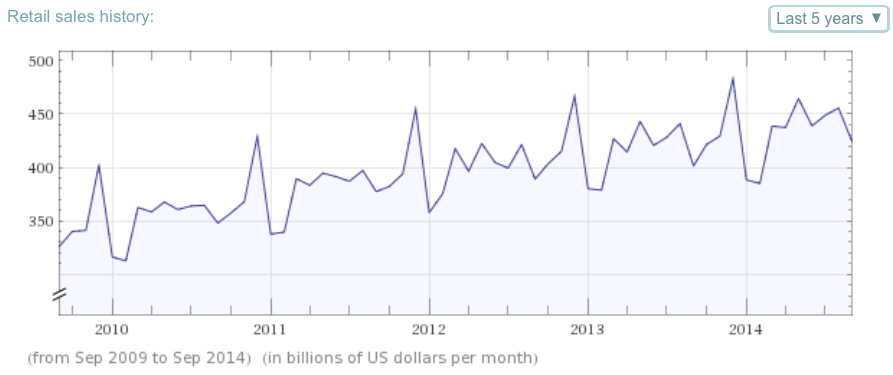
0 Comments
Leave a Reply. |
AuthorWrite something about yourself. No need to be fancy, just an overview. Archives
June 2016
Categories |
 RSS Feed
